Disclaimer: This post was generated via ChatGPT (GPT-4) based on the following prompt:
I’d like you to write a blog post in the style of Matthew Tippett from use-cases.org. I’d like the article to be long form, and to be centered around using the terms headwinds and tailwinds in the context of software engineering. The general concept is that things that slow engineers down are headwinds, and things that speed engineers up are tailwinds. Lack of documentation is a headwind that increases confusion. Just enough documentation is a tail wind that finds the balance between bootstrapping understanding for an engineer, and wasting too much time writing documentation. I’d like to also bring in the sailing concept of beating or tacking where a headwind doesn’t need to be fully removed if the engineering team can adapt and tack to still obtain some forward momentum.
When it comes to software engineering, you often hear terms like “agile” or “scrum” that emphasize the importance of flexibility and adaptability. But have you ever considered the concept of headwinds and tailwinds in this context? In this blog post, we’ll borrow these terms from the world of sailing to better understand the challenges and opportunities that software engineering teams face daily. Just like sailors, engineers need to navigate headwinds and tailwinds effectively and utilize tacking techniques to make progress, even in the face of obstacles.
Headwinds: The Challenges Slowing Software Engineers Down
In software engineering, headwinds are the factors that hinder productivity and slow engineers down. They can take many forms, including:
Lack of documentation: This headwind increases confusion and makes it difficult for engineers to grasp the ins and outs of the project. Insufficient documentation can lead to delays, miscommunication, and rework.
Technical debt: Accumulating technical debt due to rushed development, outdated technologies, or suboptimal coding practices can slow progress and make it harder to maintain and improve the software.
Poor communication: Ineffective communication among team members or with stakeholders can result in misunderstandings, missed deadlines, and duplicated efforts.
Inadequate resources: Insufficient hardware, software, or staffing resources can hinder the team’s ability to develop, test, and deliver quality software on time.
Tailwinds: The Factors Accelerating Software Engineering Progress
On the other hand, tailwinds are the elements that propel software engineers forward, boosting productivity and enhancing project outcomes. Some common tailwinds include:
Just enough documentation: Striking the right balance between too little and too much documentation can provide engineers with the necessary information to understand the project without wasting time on excessive details.
Continuous integration and delivery (CI/CD): Implementing CI/CD pipelines enables faster development, testing, and deployment of code changes, reducing time-to-market and improving software quality.
Effective communication: Clear, concise, and timely communication among team members and stakeholders fosters collaboration, streamlines decision-making, and ensures everyone is on the same page.
Adequate resources: Providing the team with the necessary hardware, software, and personnel resources can facilitate smoother development processes and faster project completion.
Tacking: Adapting to Headwinds for Forward Momentum
In sailing, tacking is a technique used to sail against the wind by moving in a zigzag pattern. By applying the concept of tacking to software engineering, teams can adapt to headwinds and still make progress, even if they can’t eliminate them completely.
Prioritization: Focus on the most critical tasks and features first, allowing the team to make the most significant impact on the project, even in the face of headwinds.
Incremental improvements: Instead of trying to tackle large, complex problems all at once, break them down into smaller, manageable tasks. This allows the team to make continuous progress and reduces the impact of headwinds.
Cross-functional collaboration: Encourage team members to share their expertise and knowledge to address challenges more effectively, boosting the team’s ability to tackle headwinds together.
Regular retrospectives: Hold regular retrospectives to evaluate the team’s performance, identify headwinds, and implement adjustments to improve productivity and overcome obstacles.
Conclusion:
Navigating headwinds and tailwinds in software engineering requires a keen understanding of the factors that hinder and accelerate progress. By acknowledging these forces and implementing tacking strategies, software engineering teams can adapt to challenges and continue making forward progress.
This is a short youser style guide on diffs. Some background thoughts are in an older blog post about Code and the Written Word.
As an engineer, your legacy within Meta is primarily the code that you create. The oldest thing that will come back to haunt you years in the future is your code. What do I mean about legacy?
We regularly come across code that was written years ago.
We do not regularly come across docs written years ago.
So, through that lens we should consider about how that legacy is created. If we work back from the code, we see diffs, near-code documentation, and design notes. I’d argue that diffs and near-code documentation are close peers in what we reference, but for the purposes of this note I’m focusing on diffs.
Hands up who has ever looked at code and thought “What were they thinking when they wrote this?”. The context for the change is probably the singular best answer to that question.
Diffs are Context for A Code Change
Diffs and the associated meta data (tasks, tests, summary, etc) all provide a context for the change.
Title provides the one-liner view of what’s happening – it’s almost the topic sentence in a paragraph. See the blog post from above
Summary provides the details on what the diff does that won’t be obvious from the diff itself. See below for a comment of design discussions in this section.
Testing is actually important in two ways. It allows other engineers to walk through your final testing before you checkin. It also provides a reference about what to test if you need to modify the code in the future. Remember that the familiarity you have with the code and the way to test it is not shared by others and won’t be shared by you in the future.
All these sections provide context on the change. It’s the perfect place to reflect on the maturity of the environment, critical factors affecting how the code is created.
Diffs are a Watercoolor for the Code
Diffs are where we get to know each other and what’s important and what is not important for individuals and the team. We get to know each other’s engineering style, our triggers, our level of pendantism. What motivates us when we look at code.
For example, my style of code review is very sensitive to the “future self“. These are more or less the same things that any other future engineer that intersects with your legacy is going to ask as well.
What’s likely to happen to the code?
What’s going to be confusing?
What’s going to fail?
What’s going to age poorly?
When I’ve forgotten I’ve written the code, what’s information will I need to quickly come up to speed.
As we converse and discuss the code, we begin to develop a Theory of Mind for the engineers that we will review the code with. This is important when preparing a diff.
When receiving feedback on the diff, accept graciously any feedback as well intentioned. However you should feel comfortable accepting the feedback and incorporating it, considering it for the future, or respectfully rejecting it. Likewise the reviewer should acknowledge that the 3 paths for the feedback and accept the best intentions of the Author.
Rarely should there be disagreements in the diffs. If there are unresolvable differences it’s time to step out and write something down and agree on those principles.
Diffs should be a Reflection of the Community
It’s never your code. If you are listening to the Watercooler discussions on the diffs, and begin to determine who is going to respond to your diff in different ways, you begin to incorporate your teammates considerations into the way you present your code. When I’m preparing a diff, I’m either conciously or subconciously thinking about what’s important for my team mates and how do I intercept with their concerns.
To be clear, I’m not saying to pander to everyone’s concerns within a diff. I’m saying consider what’s important and when you know there is something relevant that another engineer would care about and be deliberate about if you respond to that or not. If Sarah cares about architectural clarity, and you for good reason are violating that clarity speak to it directly in the diff, or followup outside of the diff. If Paul is concerned about shotgun surgery needed for small changes think about what needs to change for likely small changes.
Having these other voices in your head makes you a better engineer and allows you to live vicariously through others and get their experiences. I find this one of the strongest accelerants for engineer growth.
What doesn’t belong in diffs?
I’ll get a bit controversial here. This is my starting point, but the community around the codebase will have their own norms.
Design Review in Code Review The later changes occur in development (requirements, design, code, deployment, production) the higher cost to make the change. Sunk cost is a real killer. when designs are considered late in the cycle, code may land to avoid rework. Fortunately, there is an easy solution here is similar approach to diffs but for design – small targeted design notes that address specific concerns. Either as part of a bigger design doc, or individual docs.
We’ve all seen it. The engineer who almost feels how a system works and can within seconds can identify what’s going on. Ask them how they do it, and most of them will say “I just know”. Not helpful at all.
Then there are the mere mortals who struggle to get some things debugged and wander in circles trying lots of different things and most of the time stumbling on the problem.
I spent a while observing the intuitive engineers, observing myself, and observing others, and here is how I do systematic debugging. It’s very close to my understanding of the technique of differential diagnosis. Apparently I’m not alone (link, link).
Worked example: let’s consider a web server that is not returning data.
Step 0: Start with a System View
Ironically, this is one of the biggest gaps I see.
What’s the first thing the SWAT team pulls out when they are trying to work out what’s happening in a building? It’s the floor plan. Why? So that they can conceptualize where people would be, where the weak and strong spots are. Without a floorplan they are going in blind.
A lot of engineers are either unwilling or unable to communicate how they think a system works. This is the most critical part since the theory of operation that is in your head will guide the following steps. It ultimately doesn’t matter if the system view is right or wrong – it will evolve as more information is found.
A System View doesn’t have to be detailed, it can be superficial but you build up as you go down. It can be a set of interconnected black boxes, that can be simply accepted as working consistently and as intended, unless data indicates otherwise.
Step 1: Gather Information (Gather)
Gather whatever information is available. Logs, Failure Modes, Reproduction Scenarios, whatever is available. It doesn’t really matter how much you have, and sometimes too much makes it harder to diagnose. This starts you going.
Worked Example:, this could be error codes present in the response, amount of time that it takes to fail, do other requests work or not. In this case, we don’t have any return code, it just times out.
Step 2: Create Multiple Hypothesis (Guess)
So based on the available information, you can consider about what may be the cause. As you consider each of the potential causes, don’t worry too much about pruning too quickly. By nature you will automatically prune out some scenarios based on the available information. (See Other Thoughts).
Worked Example: There could be a server failure, server overload, bug in the page rendering, network issue, etc.
Step 3: Work out how to Prove or Refute each Hypothesis (Plan)
For each hypothesis, consider what you can do to either prove or disprove that hypothesis. As you consider what can prove or refute, there will be items that are either easy to test, or split the hypothesis. Keep in mind on these. Don’t worry too much if there is information that missing, or you can’t get completely prove or disprove it.
Worked Example: What error codes are returned (decides between server failure/overload), are other pages working (may split between server side code and/or static code), server load values.
Step 4: Conduct your Experiments
Now that you’ve got your experiments, you are ultimately either removing a potential hypothesis, or your have proven that it’s at least true. If you have refuted a hypothesis, then you can remove it from your list of things to debug. You’ve proven it right, you now have more data that helps provide a better picture. Just like 20 questions, you need to choose what experiments to run that confirm/refute as many of your hypothesis as possible. This mixes in a healthy dose of effort, information gained, number of hypothesis.
Step 5: Repeat Step 2-4
As you work through the debugging, you will continue to get more data. as you get more data, you will possibly come up with other hypothesis. This is more complex than a simple decision tree, since it’s dynamic and not designed. By cycling through multiple times you will be getting more data, and isolating where the problem is.
Note that if it was easy, it would be linear, directed and you would be done. Life isn’t that easy, so there will be mistakes, incorrect assumptions. Always keep a beginner’s mind where you observe, re-challenge and ensure that you don’t take hard positions on things that you may have excluded, new information may make a big difference.
Other Thoughts
There are a number of other things that are happening in the background here. I’ll explore some things here.
Intuitive Engineers: We’ve all seen them, the engineers who sit down with a problem. Tap a few keys, look at a couple of logs, and magically zero in on the root cause. In my experience, you can usually ask questions like “What do you know it is not?“, or “How did you determine that it wasn’t or was that?“. Most engineers will have immediate answers to those questions. If you ask them directly about how they get to the right answer, most won’t have a strong view on how they got there.
Systems Thinking: A strong part of this is process is to construct a theory of operation about how the system works. A lot of the software industry just plain suck at maintaining good architectural documentation. Independent of that, constructing a System Model of how the system works is a critical step. Like the Beginner’s Mind – allow your view to be fluid and learn and respond to new information.
Remember 20 Questions: As a kid, I’d play 20 questions with the family. The critical part to quick isolation is to segment the solution space as quickly as possible. Through the power of bisection, 20 questions allow you to segment into 1,048,576 different sub-domains. Well constructed hypothesis and experimentation will apply the halving in an ideal world. Real world is messy, but the rule still applies.
Depth vs Breadth First: There is no prescription on driving down a line of experiments – or knock off a different set of experiments first. The best choice comes with practice and improvements in intuition and judgement. Generally, if you keep getting hypothesis confirmed, continuing depth first can help isolate. When there is confusion, breadth helps first.
Beginner’s Mind:Shoshin is a Japanese term for beginners mind, similar in concept to growth mindset. However within that concept you drop preconception, biases and be in the moment with the data that you have.
Allow Yourself to Be Wrong: This is critical, if you don’t take risks, it will be hard to be learn. Learning is best when you make small mistakes that help shape your best path. You learn best when you are wrong.
Practice, Practice, Practice: I personally feel that intuition comes from improved judgement and experiencing patterns. You can only get better if you practice.
Update: So it turned out that it wasn’t an issue with Big Sur or Eero. It was a mixture of diagnosing what’s going on *before* upgrading, and still running the software. In this case, it looks like fing triggers some sort of packet storm on the network. Fing periodically does a network scan to monitor for it’s use. Although I never got to diagnosing the actual root cause, the proximal cause was “close the laptop to change where I’m debugging” fixing the problem. Once removed. Problems solved.
Tl;dr – It appears that macOS Big Sur and multiple Eero’s have a compatibility problem.
With WFH there has been a need for good networking. With a 700 Mbps cable connection and a set of Eero pros, you’d expect that the performance of the network would be good. However there would be periods with poor or no clear or identifiable cause. This needed a deeper dive into the underlying root cause. This is that journey.
After finally giving into to upgrading my 50/5 AT&T ADSL connection due to a family needing to stream 3 schools and 2 working adults we moved to 700/20 Mbps XFinity.
The behavior would be reasonably bandwidth-tested system would occasionally become completely unusable for video conferencing for the entire family. Initial analysis indicated poor ping that would take out the local network. So that was at least a reasonable symptom that I could start digging down into. Other symptoms where network based IoT devices such as wifi controlled lights would not always be 100% reliable.
Over the Christmas break I started seriously looking into the networking issues that I had been seeing. I settled on fping/influxdb/grafana after exploring a few different local networking monitoring systems and options. Almost all of the systems had some challenges that made it not suitable for my Raspberry Pi oriented home automation setup.
I live in an Eichler. For those who aren’t familiar Joseph Eichler was a mid-century architect with a particular style that is popular in the Silicon Valley area. The typical Eichler is slab floor, lots of windows and flat roof. For a modern techie that presents some interesting challenges since you can’t run cables anywhere that aren’t visible. With a need for 3 different entertainment hubs and a drop for the internet, I had previously tried powerline networking and wired connections; both causing issues for either reliability (powerline is really not that good with old wiring), or aesthetics (you can’t ever really hide network cables). So in the end I opted for Eeros and mesh networking.
So the network topology is as follows… The Kitchen is where the modem is. The kitchen is central to the house which is good for my network needs. I have a Garage (security cameras + file storage), a Family Room (TV, PS5, etc), and a Sunroom (PS4, Printers, etc).
To setup monitoring I forked https://github.com/mcwelan/fping which provided a starting point for ping scans on the network, and pushing that data into influxdb.
The data stored in influxdb is a simple collection of “ip address,ping loss, max, min, avg ping times”.
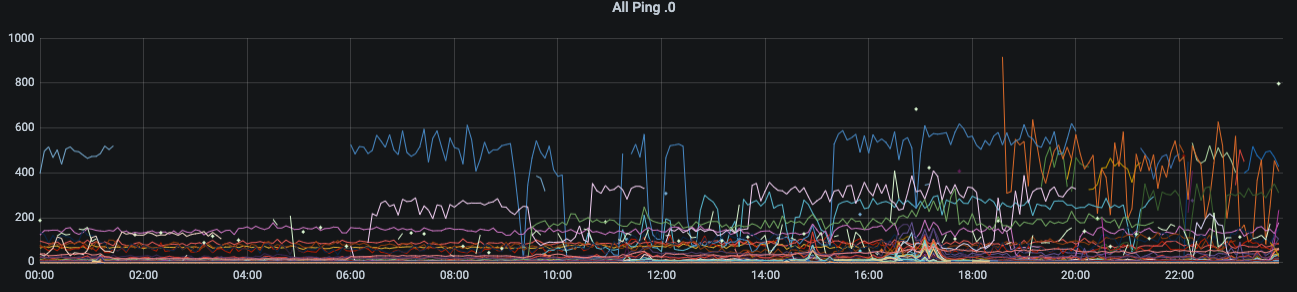
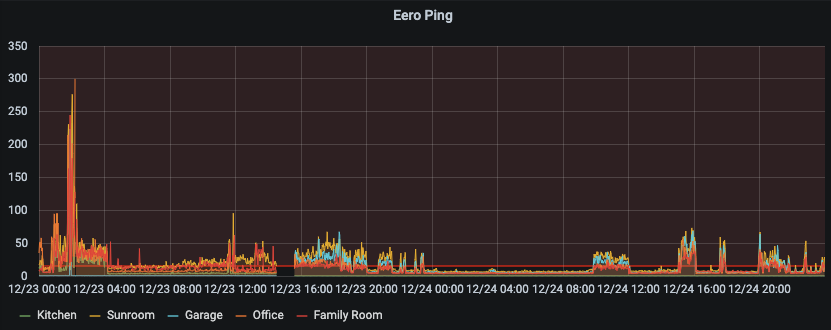
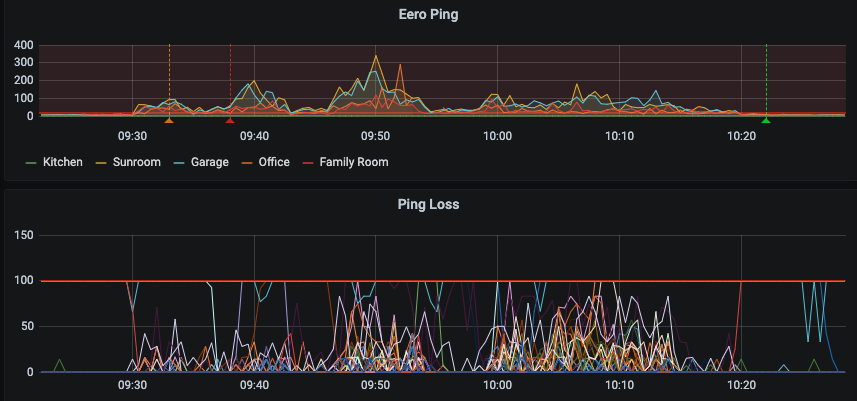
The first chart that I generated was ping. The ping graph gave an indication that the performance of the network was average, and there were likely problems, but gave no real indication of any underlying problems. Anything over 50 ms is a concern in networking, so it at least confirmed that my network was in a poor state.
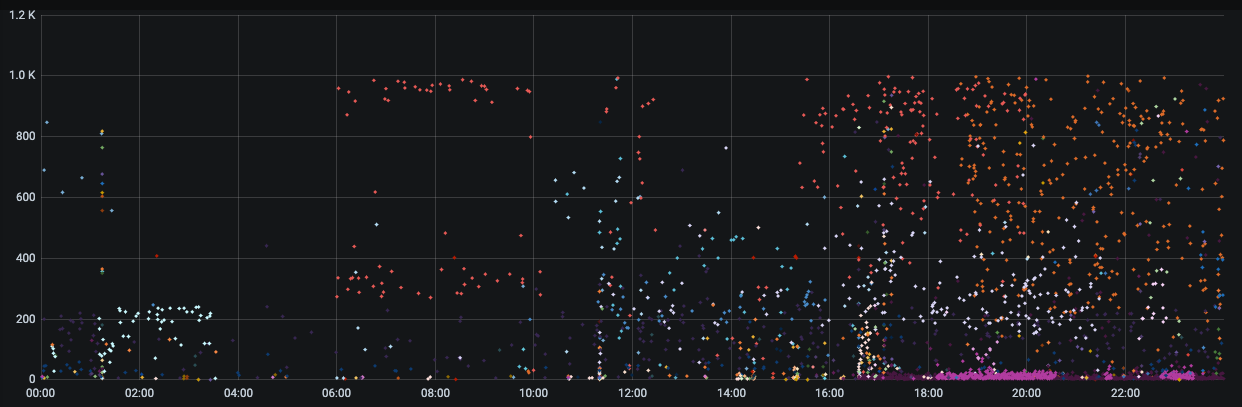
Another interesting graph that was generated showed the issues with the network were clear. In this graph I’m plotting each device (different color) with the max ping when there was a report of at least one dropped packet (loss > 0). This rejects devices operating well, as well as devices not on the network. Fping at that stage was configured with a max wait of 1000 ms, which explains the limit.
There are some really interesting behaviors in that chart. Some of the devices on the network show a switching between two or three ping rates when the network isn’t performing.
So at least I had a way to identify if the network was operating well.
After trying a few different options (disconnecting Eero’s, turning off devices, even creating a split network, etc) I found I couldn’t reliably detect or trigger a clear indication of the network performing properly. I surmised that at least the gateway network device should be as high end as possible so before Christmas I replaced gateway Eero Pro with a new Eero 6 Pro.
This did provide a slightly more consistent network experience, but I couldn’t see the point at which I connected the Eero 6 Pro to the network. Ultimately, it’s clear that this macro network analysis isn’t going to get me anywhere.
In the end I realized that I’d have to either go to Eero support or reddit r/eero to see if I can work things out. To do so meant that I’d need to really start constructing a methodical view of the network.
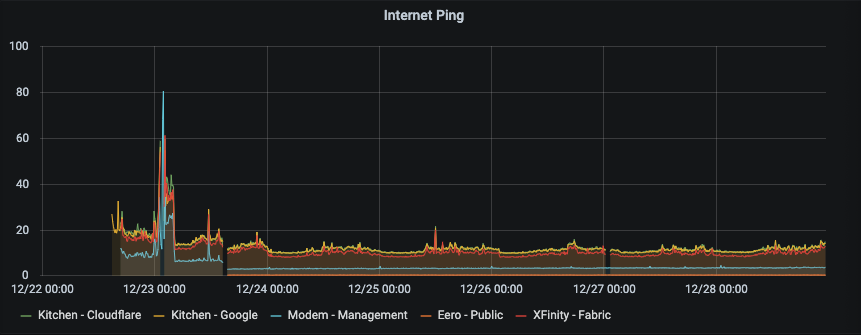
Now as a sanity check I wanted to make sure that my internet connection and upstream was good and not contributing to the network performance. By looking at some public sites (Cloudflare – 1.1.1.1, Google dns 8.8.8.8), some upstream XFinity Router, my modem’s management interface and the Eero public IP address. These are almost exactly what I’d expect – the Eero public interface is sub millisecond ping, the modem is 3 millisecond. (Note that there is a small incremental increase in the modem’s ping time, which is a different issue, which looks like it is also incremental on the overall network performance as well. This is clear from the step down on the modem side after the modem reboot on the 23rd December. That will be another investigation for another day.) But overall the Kitchen eero out to the internet seems rock solid and consistent, a diurnal pattern for the XFinity upstream link following US business hours). So at least I don’t need to consider outside of the network.
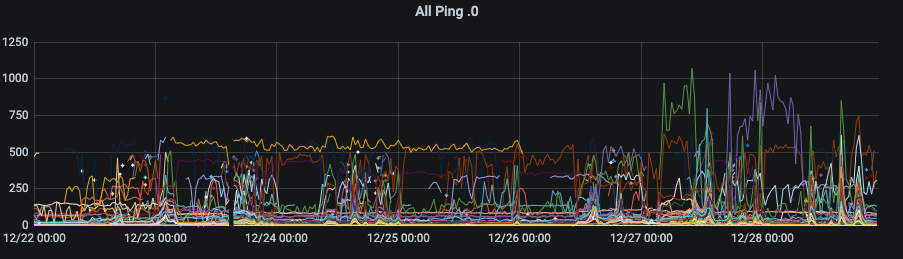
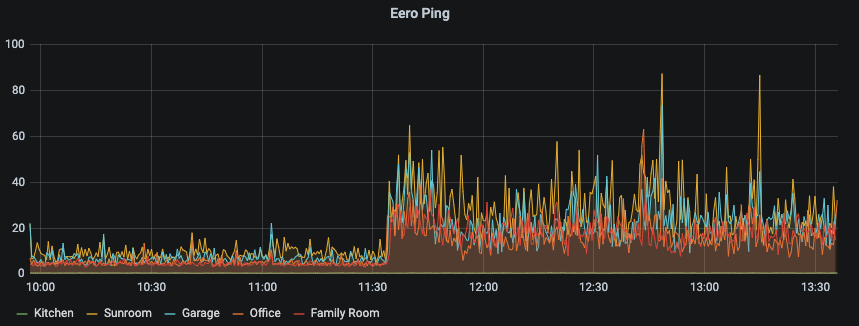
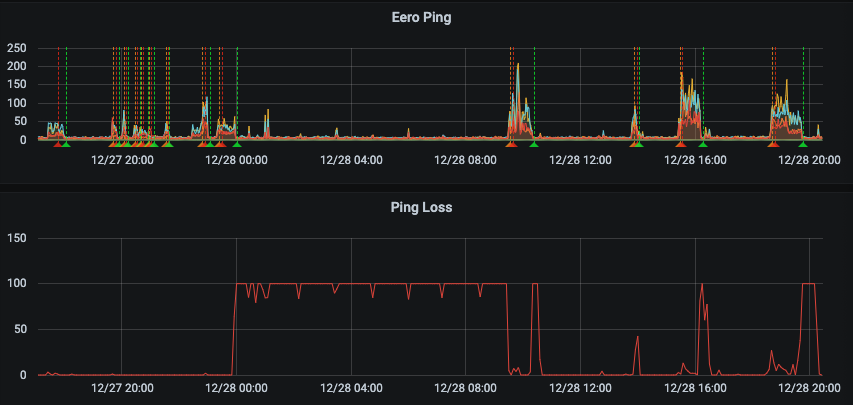
So I decided to start by looking at what’s going on a finer level. So first up, it was time to look at how the network fabric was operating at. To do this, I wanted to *only* look at the eero network addresses to see if the fabric was operating well. Since I was ping testing each node on the network, I already had most of the data that I needed. Selecting and naming all the Eeros, I could get a graph that showed the performance of the network. Bingo! This graph gave me a lot of information that I hadn’t been expecting. I can see when I took the network down (mid afternoon on the 23rd, and when I put the network back together. The network was possibly a little bit worse after the update, but there was a good signal there.
Now when the network was good, it seems very, very good. Zooming into a window of performance degradation – gives me a solid indication of what the performance is like. We can see the kitchen (basically hard wired) gives sub millisecond ping, the other Eeros are all typically < 10 ms ping time. Overall, I’d be happy if the network performed like that in general. However, the system regresses to 20-40 ms ping times on occasions.
Now this pattern allowed me to up my vigilance on what was happening. Unfortunately, I couldn’t discern any particular trigger – although I had some assumptions on the timing and recovery – focused on near normal waking hours but none of the graphs gave me any real clue.
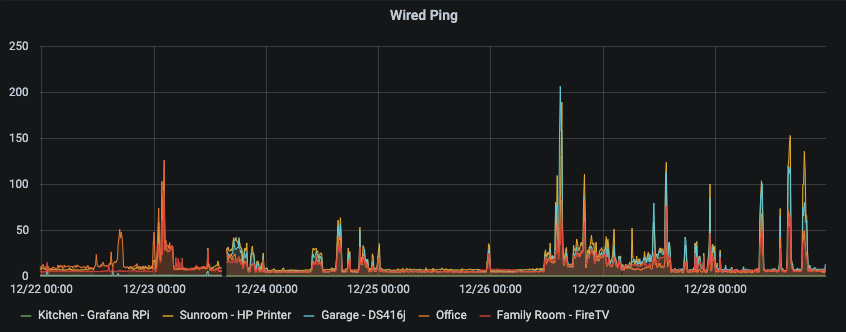
So now I had a hook about the fabric, let’s go one level up. Part of the reason I had Eeros scattered around the house was to allow me to have mini wired hubs in different places. So new ping filter for devices connected to the different Eeros. This graph gave me even more hope – the wired devices were likewise as consistent as the Eeros – when the network was performing well.
An interesting observation was that the network was *really* reliable during Christmas day – it was performing almost flawlessly. During Christmas you tend to stay off tech for a lot of the time as you spend it with Family. Of course I did some stuff just before Bed, and got up late on the 26th. Suddenly I had a hint it was something that we (possibly I) were doing on the network was causing the network instabilities.
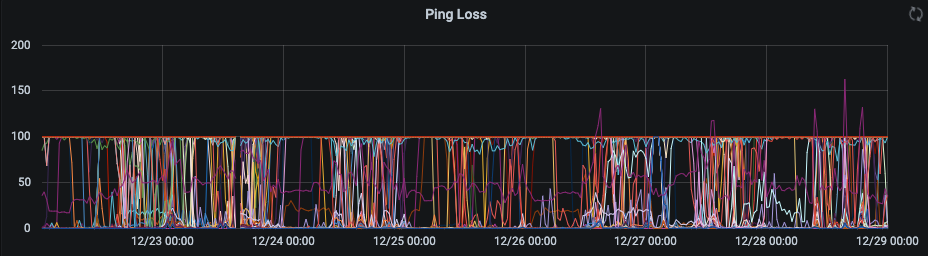
So with this information, I looked at the loss rate of the pings. I have full network visibility since I’m pinging the entire network mostly consistently. So with this information I can see when devices come on and off the network. The last 7 days looks like the other full network graphs, although in this graph I can see a substantial increase in lost packets during periods of network instability. Overall, the network has lots of devices on and off through-out the day. (I believe the loss > 100 is likely summing errors due to reducing the periods down to a single day). However this graph on its own doesn’t give much information.
So now I had enough information to start triggering alarms. I chose to create a private Discord server and send a notification to that. This at least gave me a 5-10 notification after the network had started performing poorly. After a few observations, I managed to catch this behavior. You can see around 9:30 the network started to perform poorly. At the same time the red line came down from the top. This indicates that a device came onto the network. It also was removed from the network just before the network recovered.
Isolating that particular host provided an even stronger correlation across a number of days. Although there are not enough close triggers for the presence of the host and the poor network behaviors. When the host was not connected to power, and would periodically wake up and do network activities (the dips in the lower graph away from 100), it would cause network instabilities matching perfectly with the periods of awakedness. In particular, when the host came on at 9:30, and went off at 10:20, the network issues disappeared.
That device is a Macbook Pro running MacOS Big Sur.
Now when I was armed with that correlation of the system, I started looking more deeply into the relationship. You can see that I’ve been able to recover fairly quickly when there is a network connection issue. Initially I would shutdown the entire Mac. Now I can switch off the network on the Macbook to get the network to recover.
Eeros have a primary and guest network. It appears that connecting to the guest network allows the network to operate correctly.
Sometimes the macbook will cause network performance issues immediately, other times it will strike randomly. But each time I can take the MacOS Big Sur offline and the network will recover – almost immediately.
So at least now I have the ability to get my network in a good state again. Unfortunately it means taking my primary machine offline to get it running. I think the above narrative provides a lot of useful information to allow Eero to begin to dive more deeply.
What I’ll be doing next is sitting the Macbook on a secondary – isolated network connected to the Kitchen eero. It’s less than ideal, but it should give me the ability to continue to debug and analyze while at the same time provide increased stability for the network.
Finally, there are always other interesting things that you’ll discover on your network when you begin to look closely. I can see there is a small performance degradation over time with the cable modem, and there a factory reset/reconfigure of the Roomba 960 improved the ping behavior there. Once I’ve got the fabric of the network improved, I’ll be going through each unusual behavior that I see and hunt down other network quirks.
When dealing with cloud APIs, there will typically be the concept of Throttling when API consumption moves beyond a specific limit. The particular model of throttling (leaky bucket, burstable, etc) is outside the scope of this post. For the purposes of this post, we will assume a simple, numeric rate limit (ie: x API calls per second).
The key concept is that the API is expensive either time, or compute and so there is a need to restrict the rate that the calls are made. Most developer code assumes that all APIs are free. Tight loops are common to operate code as fast as possible. Cloud APIs that distribute compute are not free and need special handling.
Rate Limiting is a client side response to the maximum capacity of a channel. If a channel has capacity to consume requests at a given rate/sec then a client should be prepared to limit their request rate. A common response to avoid implementing rate limiting on the client is that the server should allow processing at the appropriate rate. However, n the case where the API triggers asynchronous operations the response rate to the API may be fast, but the operation in the background is much slower.
Throttling is a server side response where feedback is provided to the caller indicating that there are too many requests coming in from that client or that the server is overloaded and needs clients to slow down their rate of requests. When a throttling event happens, the general client side response use exponential backoff to ensure that the system can recover even with multiple making requests at the same time.
An argument is often made that exponential backoff is a type of rate limiting. Yes it is, but exponential backoff is a partial solution with a number of problems.
AWS uses throttling heavily across its APIs and can serve as a good background for this discussion. Some AWS APIs associated with EMR have very low default API request limit (2-4 requests/second). These APIs have typical response times around 100ms. As you can see the sustained rate that an a client can access the API exceeds request limit. This represents an interesting (but easy) challenge for systems that need to call an API repeatedly. So for this example, I’m going to focus on the AWS Elastic Map Reduce DescribeCluster API. A common system management operation will be to gather data for each active cluster. In this example, assume we have 1000 clusters, and that we can’t hook into the EMR events and take a transactional on-change approach.
With an assumed maximum rate of 10 requests/second and an API limit of 4 requests/second. We can immediately see that calling the API 1000 times we can sustain 100 seconds of requests. However the API itself would take 250 to complete the scan. This of course assumes that our client is the only caller inter that API, in a lot of cases AWS internally is making requests, you may have a secondary orchestrator making requests and finally you may have an infosec scanner making requests. So the in reality our client may only be able to get 1 or 2 requests/second.
So let’s look at the naive approach. We keep hammering until we’re done at max rate. This will place us into heavy contention with other clients and will basically make life miserable for all the clients.
Following AWS Guidance we can implement exponential backoff. The general idea is that every time we receive a Throttling exception, we will back off in an exponential way, typically 2 ^ retry * base wait unit. Most approaches will have a max retry before failing or have a max retry before maxing out at some delay. Some AWS SDKs also have a transparent retry that is hidden from the API caller meaning that when you receive a Throttling exception, the SDK implementation has already backed off at least 3 times. Now if we look at our case above, we can see that we will almost immediately hit a throttling exception within the first second. Assuming we take the exponential backoff with a max wait, we will likely get 4 requests in and then wait for may 10 seconds (assuming we have max retries of 10 and base wait of 10 ms 2^10 * 10 = 1024*10 = 10 seconds), and then we try again. So effectively we’re getting 0.4 requests per second, so our full scan will take 2500 seconds. This is also ignoring other clients. Our bad behavior will also be triggering throttling events for those clients as well, likely diminishing service for all those services as well.
So currently we’ve got a poorly acting client that is ruining it for everyone. So what do we do?
We can rate limit the client. This would involve either having prior knowledge or adapting our rate based of feedback from the server. A simple form of rate limiting is to use a RateLimiter implementation that blocks code until it is permitted to continue. In our example if we had a RateLimit of 4 permits per second, then we can guarantee that we will stay below the API limit. In a quiet environment we could work through our 1000 clusters without hitting any throttling exception.
Of course hard coding 4 requests/second is naive to both the actual limit and also to any other clients. So we would likely want it to be made adaptive. We’d start of with a slightly aggressive limit of say 10 requests/second. As we hit throttling exceptions then we would adjust the RateLimiter by an appropriate amount (say halving) from 10 requests/second to 5 requests/second to 2.5 requests/second. I haven’t come any strong guidance on adapting rate limiting, but my intuition says negative exponential is probably too aggressive, but linear is not aggressive enough. We do get to a sustained un-throttled request rate by using rate limiting that is also sensitive to any sustained requests by other clients.
Planning and respecting the API request limit is the best solution. All APIs are not free to call.
So our exploration has demonstrated that sustained calls need something other than exponential backoff, and that we can get to a more predictable API rate by using rate limiting. However, we’re not there yet. There will be transient peaks that mean a period of load doesn’t represent the long term use of the API.
So to deal with transient spikes we will still need to tell our client to back off slightly when the API is under load. This does slow us down slightly, but we will definitely know that our rate limiting is preventing our client from being the problem, and that it is general external load on the API that is causing the issue.
So with a combination of exponential backoff to deal with transient spikes and rate limiting to treat the API limit with respect we have a much better solution.
But wait, there’s more.
Our past throttling doesn’t indicate that our future is throttled. So we need to ensure that our code is adaptive to both events and other clients utilizing the API. Unfortunately through most APIs there is only feedback on our behavior, so we need to either periodically optimistically improve our backoff and our rate limiting to ensure that we are close to, but not exceeding the limits.
For the exponential backoff, we need reduce our retry count periodically so that we get back to zero retries after a period of success. In our example above, we could assume that after 10 un-throttled API requests that we can discount our retry, ultimately getting back to our 0 retry state. This will allow us to deal with short term events (seconds of throttling) as well as sustained periods of loads (minutes of throttling).
For our rate limiting, we need to periodically increase our rate to feel for what the total load on the API is and find the peak sustained. Remember that in the case of AWS, any other client could be creating sustained load on the API and so we cannot assume that our sustainable 1 request/sec on the past represents our future sustained request rate, particularly when there may be other clients that are consuming some portion of the API capacity which may no longer be there. I’d likely implement a negative exponential limit increase (1/2 each time), with an incremental linear return based on the number of successful requests.
So by including adaptive rate limiting that backs off quickly and then feels for the right level, and exponential backoff that reduces the backoff after no throttling we will end up with much better overall throughput and will also end up being a good API citizen.
Unfortunately, I have never seen implementations that hand both rate limiting and exponential backoff. Most of the implementations that I have seen do exponential backoff but then go back to hitting the API at the maximum rate once the’ve done their back off. Less common, is a naive rate limiting approach that is neither adaptive or allows for backoff.
Thoughts, comments, seen a good rate limiting and backoff implementation? Add them below.
Electric Vehicles represent a challenge for the future. This blog post imagines an EV future and what it may mean. I’m an outsider to the EV space, having had a used 2017 Nissan Leaf for just over 4 months.
I’m also going to look beyond the irrational and skewed EV world that we live in currently, with free Supercharging and heavily workplace subsidized EV charging. In this future, people won’t be sitting in their cars for 30 minutes on a Friday evening to fill their car for free. Neither will we be getting juiced at work for free, having never charged your car at home or at a EV charging station. You have to pay for electricity in this world, one way or another, grounding this post in a mostly rational economic world.
Charging Options
In this post I will explore the two fundamentally two types of EV charging available today. Although there are others in the future, and have been available in the past, the two most common forms available now in the US are 6.6kW Level 2 (L2), or DC Fast Charging (DCFC).
Charging at home – L1 or L2
In this first scenario, which is mostly a real world scenario now, homes are equipped with a L2 chargers. You install the number of chargers that you need for your car. L2 chargers provide around 6.6kW, or about 25 miles per hour.
In a simplistic scenario, you plug in when you get home, and unplug when you leave for work. This would give around 12 hours of charging per day, or about 300 miles of charging overnight PG&E, my local power supplier, has an EV rate which provides a heavily reduced rate from 11 PM to 7 AM, leaving about 8 hours or 200 miles of charge each night. That’s sufficient for a very large commute or a reasonably sized car.
For small commutes, L1 also works, but at 3.3kW, you will only be able to recharge less than 100 miles overnight which places you at range anxiety if you can’t charge above your previous day’s charge. Electricity rates that make charging very cheap between 11 pm and 7 am, put the consumer in a difficult “do I pay more” situation. Don’t underestimate the psychological barriers to paying double the off-peak rate, even if it is much cheaper than the retail rates at public stations.
Charging on the Road – DC Fast Charging
The across the country road trip in a Tesla is a clear possibility with the Supercharger stations. These DCFC chargers range from 20 kW all the way up to 350kW. The common rules of thumb range from 1 hr/100 miles, up to 1 hr/300 miles for 150 kW and 20 minutes at 350 kW.
Most of the DCFC in the bay area charge you per minute, rather than per kWh, so there is a strong disadvantage to go beyond the 80%, in which case you are starting to pay for parking rather than charging. DCFC that charge per kWh usually charge a premium, likely balancing the time of use with the charge they deliver.
Either way, the DCFC is the closest that we will get to the gas station experience unless we go down the battery charging or start pushing up to high hundreds of kW charging. Which when you think about how electricity behaves at high power levels, the safety interlocks, cooling and so on will make high kW charging a challenge to install, maintain and keep safe.
Charging Scenarios
At this stage, I can’t see too many other fundamental options, cheap and slow, or fast and expensive. Time may prove me wrong, but unlikely in the next 5 or so years.
Home Charging
Home charging with L2 charging is likely to be the most popular and predictable charging experience. Your car is charged when you get up in the morning, you do your driving during the day, come home and plug your car back in and it’s ready fully charged by the next day. If your daily commute and errands sit below the night time charge rate of around 100 miles, you should be fine to continue with this model for as long as you want.
Road Trip Charging
The Tesla Supercharger or the Electrify America network are good example of road trip charging networks. The DCFC chargers on these networks vary between 150 kW to 350 kW. Most of the reports from people using these networks indicate that in most cases the trip stops (typically after 4-5 hours of driving) are completely reasonable to charge while having a short break. Most online articles (mainly Tesla) indicate that the the car is typically charged before the driver has finished their break.
Destination Charging
Destination charging covers the scenarios where you go somewhere and you plug the car in at the destination. These destinations are typically work, business or other activities. Most of these are L2 chargers for a typical commute of 10-20 miles, a car is recharged from the trip in 1-2 hours.
Work Charging
Work charging is an interesting challenge, the car is going to be at the office for about 8 or 9 hours. If the car is charged at night is above 80% when destination charging starts, it may take 2-3 hours to complete the charge. At many workplaces there are 2 or 3 shifts of people shuffling cars and coordinating with each other through corporate chat systems. I usually go for a car spot that doesn’t have enough available charger, relying on colleagues to move the charger over when they finish the first shift, leaving me the option of moving the car early afternoon or if there are spots open – not at all.
Shopping or Leisure Charging
Destination charging at a shopping center or leisure location is a slightly different scenario. Although most destination chargers are L2, the amount of time spent at the location may be measured in a few hours. For the purposes of this post, I’ll assume that the average distance to shopping or leisure will be around the same 20-40 miles from home.
In most cases the amount of time that a car is parked and charging will be slightly or considerably less than the amount of time needed to get the car fully charged.
Future Charging Directions
Charging at scale will present some critical challenges for electrical infrastructure. A large number of DCFC charging status can easily overwhelm the available power within a particular area. Commercial installations for power charging will invest to support what is needed. Destination charging may struggle with the electrical installation requirements for charging at scale.
Battery Smoothing
For home L2 charging, solar and house batteries like the Tesla Powerwall will be extremely useful for ensuring spare charging capacity is available. Although the Powerwall 2 is only around 13.5 kW, much less than the capacity of the EV battery, it does help reduce the dependence on the network for charging.
Another benefit of energy storage is that it allows short term peak consumption of energy above what would be available from the utility.
Adaptive Charging
As described above, most of the destination charging has a difference between the amount of time that a car will be charging and the amount of charge that will be required.
Allowing cars to have a target time and adjusting the charge rate to ensure that the car is fully charged at the time that the driver is ready to depart. If a car needs 10 kWh of energy, it can charge at a very low rate for 8 hours. Being fully charged by the end of the day. Likewise at a shopping center, declaring a departure time allows slower but consistent charging to get a car fully charged by the time that a customer is ready to leave.
This has two benefits:
Allowing more charge points to be installed
Reducing the electrical infrastructure required to support the peak load from the number of charge points installed.
Powerflex offers such a system, having installed some of these systems in the Los Altos/Mountain View school districts. The powerflex system is captured well with the graphs below.
Obviously, adaptive charging will not be suitable for road-trip style charging where the starting.
The Future – Energy Storage and Adaptive Charging
Ultimately, the charging future I see is a blend of energy story and adaptive charging. As the EV revolution continues, with places in Europe expecting to be weaned off internal combustion engines by around 2025. I look forward to driving into a car park and be presented 50 to 100 L2 charging stations and then selecting when I think I’ll be leaving the car park, knowing full well that the car will be mostly charged by the time I get back.
What price should we expect to pay for this sort of charging? It will likely be per kWh plus a small space usage rate. I’d be happy paying a 50% to 100% premium on the best charge rate that I’d be able to get at home.
For just over a year now, I have been involved with Plato as a mentor. If you don’t know, Plato is a subscription platform that links engineering managers to mentors. As a Mentee, you sign up for unlimited mentoring sessions and access to a Slack channel. As a Mentor, you make yourself available for one or two 30 minutes slots per week. Plato’s system allows Mentees to connect with Mentors who are likely able to provide insight or guidance on their particular leadership problems.
I’ve been asked by a few people regarding the lack of symmetry between the Mentee, Mentor, and Plato. I’ve thought about this quite a lot to ensure I have a mental model for the collective benefit 3 parties get. Clearly, for the Mentee and Plato relationship is clear. Plato provides access to Mentors, and the Mentee (or Mentee’s company) pays for the privilege, fairly simple charge for facilitation.
What about the Mentor? On the surface, the Mentor receives no direct monetary reward, they have the opportunity to expand their network through Plato’s networking events. Plato obviously receives access to the top tier of engineering leadership all quite happy to provide time to the paid Mentees. On the surface, the Mentor receives very little as part of this relationship.
Why have a Mentor?
Personally, I moved through most of my career without what I would call a strong mentor or coach. My lessons were learned the hard way, and I apologize in retrospect to those employees who helped me shape my management views and understanding of how business works. As I’ve progressed in my career, I’ve become a more experienced manager, I’ve come to strongly support coaching and mentoring. It’s a way to help avoid some of the leadership potholes that as humans, we are prone to stumble into again and again. Guidance or advice at just the right the time can help immensely.
I strongly recommend that people find Mentors to help navigate their career. Even if you are a naturally introverted person, you should still look to find a Mentor, it’s hard, it’s awkward, but it is still valuable.
One comment I’ve heard from a couple of Mentee is that they are ultimately concerned that they will be imposing on the time or advise of the Mentor. Generally Mentors see Mentoring as a professional gift to the industry. Assuming a formal or semi-formal Mentoring relationship, unless you have an agreed cadence of communication, contacting them once or twice a month is likely what is expected by being a Mentor. Most Mentors are senior professionals, they will know how to ask you to back off.
Why Mentor?
As a Mentor, I have the opportunity to pass my experiences forward. I can see new engineering managers making the same mistakes that I made, bringing forward the same assumptions. Finding small ways that I can help the engineering management community not re-learn the lessons the hard way.
Why do I Mentor through Plato?
Plato provides a very interesting value proposition for a Mentor. I personally have 1 mentoring session each week, with a monthly panel mentoring session. So I’m working with about 7 Mentees each month. Each of these Mentees is at the point where they are having a particular problem that they want or need to solve, and so they are real problems needing real advice and guidance.
This speed-dating approach to mentoring actually has some interesting benefits for the Mentor. The biggest benefit that I get is the need to think through rapid-fire management scenarios during the 30 minutes, typically 2-3 topics are discussed in each session. This type of mental engagement and scenario practice would typically take months of real-world management to experience.
Muscle Memory and Tuning Judgement
Like any skill, practice makes perfect. When a martial artist practices moves and scenarios over and over, they are training their subconscious to recognize the scenario and automatically respond in a practiced way. Similar near automatic or intuitive judgment comes to others like chess masters who can see a layout of chess pieces on a board and have a good idea about the state of the board and likely good moves that can follow. Grandmasters can usually detect how close to an end-game the board is.
What appears as expert intuition, can usually be attributed to gut feel, but rather practiced judgment. This practiced judgment comes from automatically recognizing a scenario and automatically knowing sensible next steps. The more experience you get, the better your recognition of a scenario, and the better you are able to respond.
Managers go through a similar process. A manager either needs to have a large amount of experience, or have a way of mentally exercising these scenarios again and again. In the real world, a manager deals with their staff with issues coming up a few times a week and needing months to resolve.
When mentoring, a Mentor is able to quickly go through the larger number of these scenarios at a rate faster than they would experience in their normal professional life. This helps train the practiced judgement, making the manager more effective and faster on their feet.
But be Aware of Bias
A highly self-confident Mentor, can train poor judgment in the same way. If a Mentor isn’t careful, their responses to the Mentee’s problems can drift from what works well for the Mentee to what is simply trained into the Mentor’s mental model. This is where both the Mentee and Mentor have some responsibility.
The Mentee’s first responsibility is to take the advice, as a well-intentioned response to the scenario presented. The Mentee must integrate the advice into their real world scenario and take actions as appropriate. Each Mentor’s solution may be only a partial solution to the Mentor’s problem.
The Mentor’s responsibility is to both appraise the scenario and determine what they might do in that situation. The appriasal stage is the most critical. A Mentor that doesn’t adapt to the Mentee’s actual sitation may end up pushing the Mentee down the knife edge that represents the Mentor’s history. Hoping that you can take the same life steps of your favorite artist and repeat their results, is folly. The linear path that their life has taken also down a knife edge. Any variance, be it a chance meeting or a different decision and the path is different.
So the 2005 Toyota Sienna needed to be replaced, and I got a 2017 Nissan Leaf. This particular model is an S trim (read cheap) in Red. So now that I’ve made the leap into electric vehicles, it is time to determine what the options for charging are. I’ve had the car for about 2 weeks as of this writing, so I am definitely not an expert. So there may be some inaccuracies in the information below.
Fortunately at work I have free EV charging, so knowing how the public charging works is part intellectual exercise, as well as a preventative in the case where I really need it. Right now I don’t have an EV charger at home (and neither do I have solar).
For reference, my Sienna would run at about 16 mpg, and I would get around 350 miles for a full tank of gas of around 18 gallons. So a full tank would be around $80. More on this later.
Charging in the South Bay area of Silicon Valley has a few options, with a charging option usually being within a few miles. The most popular options are Chargepoint, EVgo, and Volta. Some cities (eg: Palo Alto) and some stores (eg: Best Buy) have free charging (typically through Chargepoint). There are also some interesting charging deployments coming up through companies like Powerflex, where the Mountain View/Los Altos school district is deploying charging for school staff with discounted rates after hours for the public.
Different public companies have different ways of charging. Chargepoint is typically charged at a rate per hour, pro-rated against usage. EVgo charges per minute. Blink apparently charges per kWh for their chargers. I’ve had a quick play with charging at both Chargepoint and EVgo stations, so the following represents how I see charging working. The sample space is small (three charging sessions), but the numbers seem to reflect what I’ve been seeing implied with blogs.
So let’s start with Chargepoint. I’ve used Chargepoint at Best Buy, City of Sunnyvale, and Cupertino Rotary club. The Sunnyvale Best Buy charger was broken, the Chargepoint would detect and start, but would never deliver any power. It is marked as Free, so it might be a good option if it worked. It might be that the charger locking head was broken and so was unable to “lock”, and so would fail. Interestingly, Chargepoint didn’t notify that there was a problem.
The other times I’ve used Chargepoint it worked as expected. You swipe, plug in, and the charging starts. You go do what you need to do and come back, and be on your way. In both these cases, the systems where 6.6kW rated units. According to the Chargepoint app, one provided 6.0kW, the other 6.5kW. Since Chargepoint charges per hour (or part thereof), a poor charger choice could make quite a difference. In these two cases, I was there for just under an hour and had around 6kW added to the car. This is equivalent to about 20-24 miles. Not bad for around $1.50. Both City of Cupertino and City of Sunnyvale both charge $1.50/hr for charging.
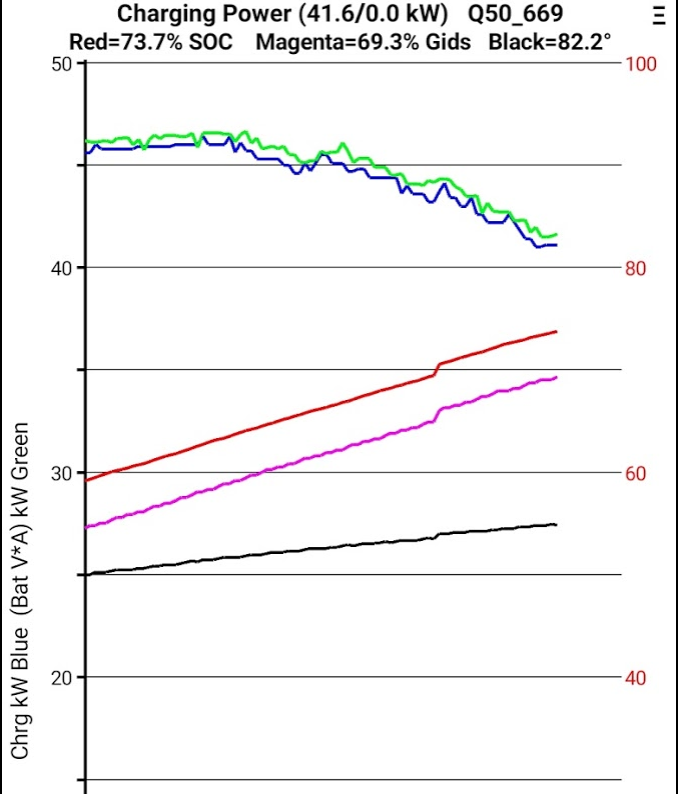
Now EVgo is a bit different, they have DC chargers, capable of delivering about 40-50 kW. I charged for just under 8 minutes at an EVgo station, costing $2.10 (they round down, which is nice). They delivered 5.8kW of power in the 8 minutes.
DC chargers generally only deliver power to 80% of full, so there are some unusual behaviors that happen on the way to 80% that are actually quite important. In the case of EVgo, I was monitoring the power with the Leafspy Pro app on my phone as it was charging. The image below is a screenshot.
As you can see the initial charging power (green & blue line) was around 46kW for the first few minutes, and then began to drop off as the system approached 80% (red line). This is not unexpected, but it does have an impact on the overall power delivery for a session. The initial rate was 46 kWh, the final rate was around 41 kWh, and the average was around 43kWh.
The table below tabulates the costs as rates for the different charge rates that I used.
Type
Type
kWh
Cost
Time
Cost/kWh
Charge Rate
EVgo
DC
5.816
$2.10
8
$0.36
43.99
ChargePoint
Level 2
5.403
$1.37
54
$0.25
6.00
ChargePoint
Level 2
6.97
$1.59
64
$0.23
6.53
By comparison, the PG&E charge rate is $0.22 for Tier 1 or $0.27 Tier 2 for the base E-1 rate plan, or for my bill (which includes the Silicon Valley Clean Energy Electric option) it comes at around $0.21 or kWh. So with my current usage, the a good Chargepoint Level 2 charger will be cost equivalent to my plugging in at home with the E-1 rate sheet.
I’ve applied for the EV-A rate sheet from PG&E, even without the EV it would actually save me about $10 over the course of a year. With the EV-A rate sheet, PG&E provide Peak at $0.49, Part Peak at $0.27 and Off Peak at $0.13 during Summer. During winter, it is $0.34, $0.21, and $0.13 respectively.
The three options that I haven’t used yet are Blink (apparently $0.49/kWh for DC fast charging), Powerflex (apparently $0.15/kWh with a mix of DC and Level 2), and Volta (apparently Free).
So with the EV-A rate plan it is considerably cheaper to charge the car at home off-peak vs a public charger. Powerflex is not local to me, but intriguing and useful in a pinch, and Volta stations tend to be fairly busy (free of course is always in demand). Blink seems to have a charging model that would be a last resort.
With all the per hour charging systems, you really want to ensure you get the best bang for your buck, so you should make sure you know which chargers deliver the highest power. A good Level 2 can provide 6.6kW, but a poor one can deliver considerably less. Knowing the good Level 2 chargers can give you an effective 10% discount on pricing. With a DC charger, it looks like you want to do the same, knowing that the stakes are even higher.
Finally, public charge stations that charge per hour, really are intended to move you from empty up to something safer, but you shouldn’t expect that they should fill your car up. For DC, you definitely start getting power limited at around 65%, and with Level 2, I’d expect you can go higher, but you’d find the charge rate would begin to drop off for the final trickle charge.
If in the end, I don’t have charging at work, I’ll likely charge at home and be comfortable knowing that home charging provides very attractive pricing with the convenience of a full car first thing in the morning.
I’m likely to go Solar before the end of the federal tax credit, so then it will completely change the equation. I’m paying close to $2000/year for power, so with the new Tesla Solar pricing (around $8000 for a 4k unit), it will likely pay itself off within 5 years, even up front.
Each company will have its own leveling guide, ask your HR department or search your intranet. It should go through a clear set of expectations for each grade and the different attributes that each grade should possess. Your manager may not even be aware of them – but they should provide a basis for you to understand the career progression.
Flat organizations will have only 3 or so (Jr/Mid/Senior/Exec), other organizations will have many (Assoc/Eng/Snr Eng/Staff Eng/Snr Staff Eng/Princ Eng/Snr Princ Eng/Dist Eng/Fellow). Apply the following to your company and don’t expect direct portability between companies.
Grade Levels
First, we’ll go over a hypothetical set of grades – generally well rounded against a lot of companies – some will have different titles, but will generally have a a common set of attributes.
The Career level is arbitrary but what you’d expect the middle of the curve people to be operating at. Individuals will peak at a particular point and will then progress slower. Realistically, most good people will peak at what I am calling a Staff engineer. Some will get frustrated with the leadership aspect of the senior grades and peak at Senior Engineer. The management ladder equivalence is also arbitrary, but should serve as a guide.
Junior/Associate Engineer/New College Grad – Assumed to know nothing, can code, have minimal understanding how business work and what a professional life entails. Hand held or teamed with a more senior engineer to help get an understanding. Career level 0–2 years.
Engineer – Assumed to be able to work through tasks with minimal supervision. Will come back and ask for more work. Not expected to identify and fix secondary problems. Not expected to drive generalized improvements or be strong advocates for best practices or improvements. Quite simply a “Doer”. Scope is typically at a sub-component level. Career Level 2–5 years.
Senior Engineer – Beginning to be self directed. Expected to be able to work through small projects and foresee issues that may come up. Likely expected to mentor or lead sub-teams or development effort. Scope is typically at a component or subsystem level. Career Level 5–10 years – equivalent to a team lead.
Staff Engineer/Architect – Runs the technical side of projects, leader and mentor for a team. Holder of a high bar for best practices, quality and engineering workmanship. Scope is across a system, or across multiple subsystems. Career Level 10–20 years – equivalent to a manager.
Fellow/Distinguished Engineer – Runs the technical side of an organization. Interlopes on many projects, defines the strategic direction for the technology. Career Level 15–30 years – equivalent to a director or VP.
It’s not about the code
Hopefully it becomes clear from the descriptions that pretty much from Senior Engineer and up, the technical role includes increasing amount of leadership. This is distinct from management. The leadership traits are about having your peers trust and understand you direction, being able to convince peers, managers and other teams about your general direction. Being able to deliver on the “soft” skills needed to deliver code.
There is a tendency for organizations to promote based on seniority or time in role, or even worse, based on salary bands.
Applying this to Yourself
Ground yourself what your level means to you, the organization and your team. There may be three different answers.
Introspect and ask yourself if you are demonstrating the non-management leadership aspects of a team leader or junior manager? Do you show confidence? Do you help lead and define? Do you demonstrate an interest in bringing in best practices? Do you see problems before they occur and take steps to manage them?
Consider where you are in your career.
Your Career is a Marathon
A final thought, although you indicate a few years in the industry, I’ve seen engineers gunning for “Senior Engineer” 3 years out of college and staff engineer 3 more years after that. My big advice to them is what the hell are you going to do when you get to 6 years into a 40 or 50 year career and realize that you’ve peaked or you have some serious slow grinding for the next 20 years. I’m concerned about good engineers who become fixated on the sprint to the next title and not the marathon of their career.
In the Six Page Narratives that I have read, reviewed or discussed, I have always been frustrated with the tendency for authors to not use standard mechanisms to ease the cognitive load of the reader. For example, below is a typical paragraph that you might find in a Six Pager.
Based on our review of the customer surveys, we can see that the US has customers preference as Product A – 10%, Product B – 40%, and Product C – 20%. EU interest is Product A – 20%, Product B – 50%, and Product C – 10%. Finally, JP customers have a preference of Product A – 40%, Product B – 20% and Product C – 15%. Consequently, we will be focusing on Product A and Product B.
To me, this is clearly tabular data that should be structured in a way that walks the reader through the data providing support for the argument.
Geographic Region
Product Preference
A
B
C
US
10%
40%
20%
EU
20%
50%
10%
JP
40%
20%
15%
As can be seen, there is a clear worldwide preference for Product A and B.
It is clear that with the narrative format, the information needs to be pulled apart by the reader to clarify and confirm the conclusion. In the tabular format, the information is presented for simple confirmation of interpretation.
It has always felt to me that the narrative form is unfair and unsympathetic to the reader, forcing mental gymnastics where the gymnastics should not be needed. In my own writing, I have always found the decision to tabulate vs narrate is a decision primarily based on the information density and valuable space consumed where in some cases every line counts.
Recently, I read Thinking, Fast and Slow. In this book, Daniel Kahneman gave me that lightning bolt answer to what had vexed me about Six Page Narratives so much.
The Six Page Narratives are typically consumed in Amazon’s infamous Reading Meetings, where you have a number of senior leadership people who take the first 10-15 minutes of a meeting to read a Narrative or PR-FAQ, before discussing. The senior leadership in these meetings are generally very smart and have years of experience. You want these leadership team to be engaged in reviewing the document and surface areas that the author and their supporting team may have not considered. You need the reader to be cognitively engaged to be able to successfully provide that extra input.
According to Daniel Kahneman’s book, when a reader is having to do cognitive work to consume some information, they will typically think deeper and more broadly than if they were presented the information in a way that lowers cognitive load.
Assuming that Thinking, Fast and Slow is correct, it puts the onus on the author of a narrative to make a conscious decision as to where that knife edge is between getting reader to think through the problem, possibly gaining deeper insights, or to present the information and allow them to be taken on the cognitive easy course. Or put slightly differently, how to make the choice between engaging a reader, or simply informing them.