Update: So it turned out that it wasn’t an issue with Big Sur or Eero. It was a mixture of diagnosing what’s going on *before* upgrading, and still running the software. In this case, it looks like fing triggers some sort of packet storm on the network. Fing periodically does a network scan to monitor for it’s use. Although I never got to diagnosing the actual root cause, the proximal cause was “close the laptop to change where I’m debugging” fixing the problem. Once removed. Problems solved.
Tl;dr – It appears that macOS Big Sur and multiple Eero’s have a compatibility problem.
With WFH there has been a need for good networking. With a 700 Mbps cable connection and a set of Eero pros, you’d expect that the performance of the network would be good. However there would be periods with poor or no clear or identifiable cause. This needed a deeper dive into the underlying root cause. This is that journey.
After finally giving into to upgrading my 50/5 AT&T ADSL connection due to a family needing to stream 3 schools and 2 working adults we moved to 700/20 Mbps XFinity.
The behavior would be reasonably bandwidth-tested system would occasionally become completely unusable for video conferencing for the entire family. Initial analysis indicated poor ping that would take out the local network. So that was at least a reasonable symptom that I could start digging down into. Other symptoms where network based IoT devices such as wifi controlled lights would not always be 100% reliable.
Over the Christmas break I started seriously looking into the networking issues that I had been seeing. I settled on fping/influxdb/grafana after exploring a few different local networking monitoring systems and options. Almost all of the systems had some challenges that made it not suitable for my Raspberry Pi oriented home automation setup.
I live in an Eichler. For those who aren’t familiar Joseph Eichler was a mid-century architect with a particular style that is popular in the Silicon Valley area. The typical Eichler is slab floor, lots of windows and flat roof. For a modern techie that presents some interesting challenges since you can’t run cables anywhere that aren’t visible. With a need for 3 different entertainment hubs and a drop for the internet, I had previously tried powerline networking and wired connections; both causing issues for either reliability (powerline is really not that good with old wiring), or aesthetics (you can’t ever really hide network cables). So in the end I opted for Eeros and mesh networking.
So the network topology is as follows… The Kitchen is where the modem is. The kitchen is central to the house which is good for my network needs. I have a Garage (security cameras + file storage), a Family Room (TV, PS5, etc), and a Sunroom (PS4, Printers, etc).
To setup monitoring I forked https://github.com/mcwelan/fping which provided a starting point for ping scans on the network, and pushing that data into influxdb.
The data stored in influxdb is a simple collection of “ip address,ping loss, max, min, avg ping times”.
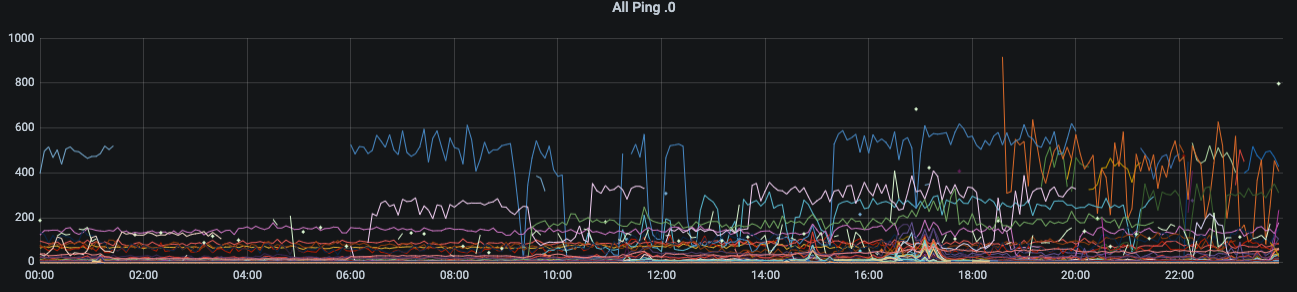
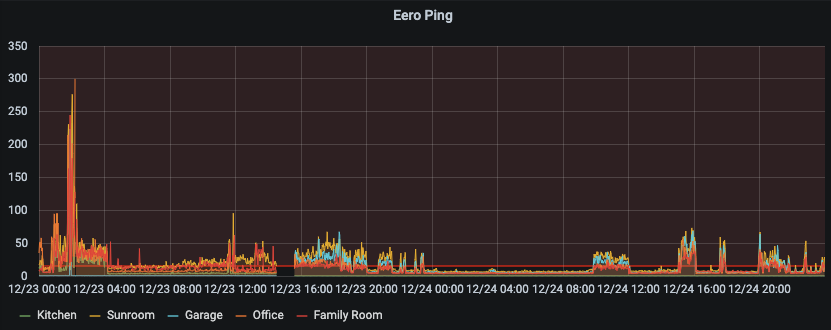
The first chart that I generated was ping. The ping graph gave an indication that the performance of the network was average, and there were likely problems, but gave no real indication of any underlying problems. Anything over 50 ms is a concern in networking, so it at least confirmed that my network was in a poor state.
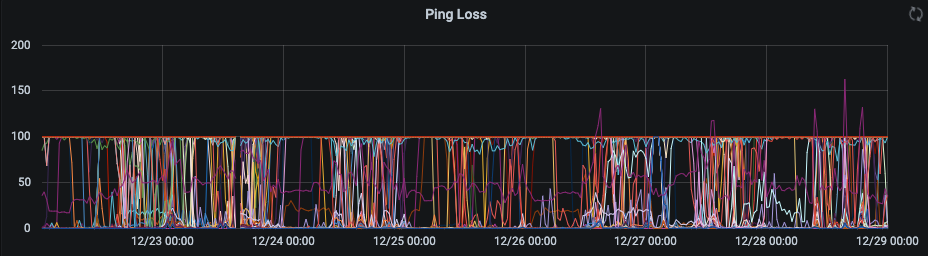
Another interesting graph that was generated showed the issues with the network were clear. In this graph I’m plotting each device (different color) with the max ping when there was a report of at least one dropped packet (loss > 0). This rejects devices operating well, as well as devices not on the network. Fping at that stage was configured with a max wait of 1000 ms, which explains the limit.
There are some really interesting behaviors in that chart. Some of the devices on the network show a switching between two or three ping rates when the network isn’t performing.
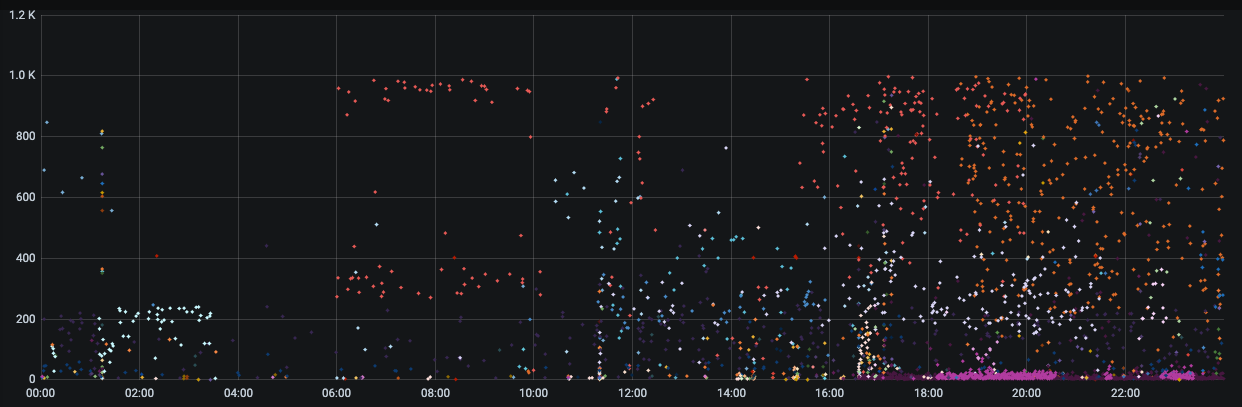
So at least I had a way to identify if the network was operating well.
After trying a few different options (disconnecting Eero’s, turning off devices, even creating a split network, etc) I found I couldn’t reliably detect or trigger a clear indication of the network performing properly. I surmised that at least the gateway network device should be as high end as possible so before Christmas I replaced gateway Eero Pro with a new Eero 6 Pro.
This did provide a slightly more consistent network experience, but I couldn’t see the point at which I connected the Eero 6 Pro to the network. Ultimately, it’s clear that this macro network analysis isn’t going to get me anywhere.
In the end I realized that I’d have to either go to Eero support or reddit r/eero to see if I can work things out. To do so meant that I’d need to really start constructing a methodical view of the network.
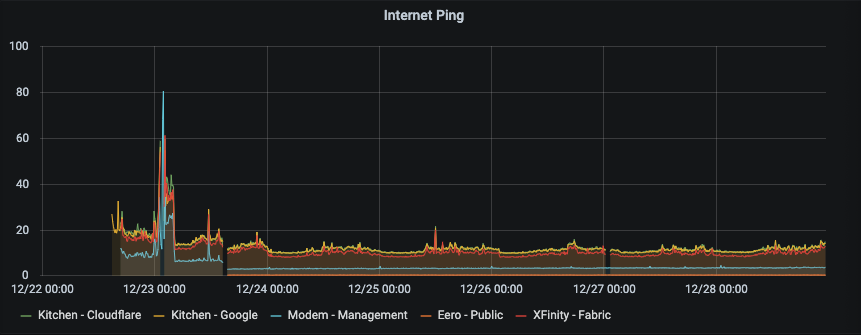
Now as a sanity check I wanted to make sure that my internet connection and upstream was good and not contributing to the network performance. By looking at some public sites (Cloudflare – 1.1.1.1, Google dns 8.8.8.8), some upstream XFinity Router, my modem’s management interface and the Eero public IP address. These are almost exactly what I’d expect – the Eero public interface is sub millisecond ping, the modem is 3 millisecond. (Note that there is a small incremental increase in the modem’s ping time, which is a different issue, which looks like it is also incremental on the overall network performance as well. This is clear from the step down on the modem side after the modem reboot on the 23rd December. That will be another investigation for another day.) But overall the Kitchen eero out to the internet seems rock solid and consistent, a diurnal pattern for the XFinity upstream link following US business hours). So at least I don’t need to consider outside of the network.
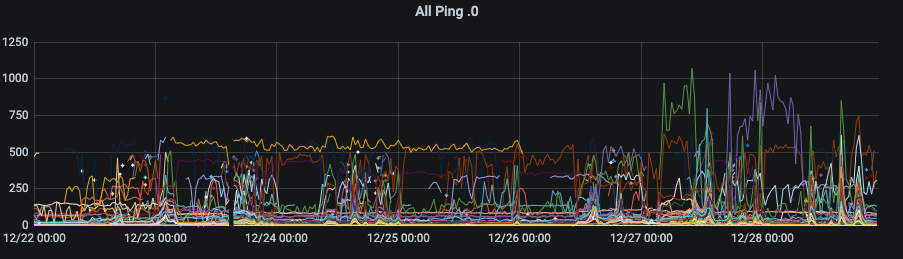
So I decided to start by looking at what’s going on a finer level. So first up, it was time to look at how the network fabric was operating at. To do this, I wanted to *only* look at the eero network addresses to see if the fabric was operating well. Since I was ping testing each node on the network, I already had most of the data that I needed. Selecting and naming all the Eeros, I could get a graph that showed the performance of the network. Bingo! This graph gave me a lot of information that I hadn’t been expecting. I can see when I took the network down (mid afternoon on the 23rd, and when I put the network back together. The network was possibly a little bit worse after the update, but there was a good signal there.
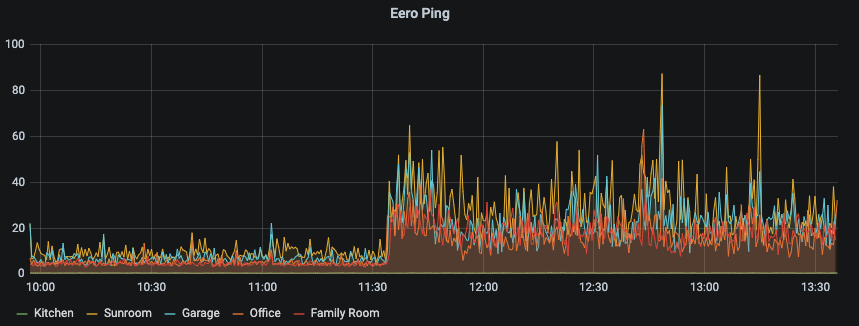
Now when the network was good, it seems very, very good. Zooming into a window of performance degradation – gives me a solid indication of what the performance is like. We can see the kitchen (basically hard wired) gives sub millisecond ping, the other Eeros are all typically < 10 ms ping time. Overall, I’d be happy if the network performed like that in general. However, the system regresses to 20-40 ms ping times on occasions.
Now this pattern allowed me to up my vigilance on what was happening. Unfortunately, I couldn’t discern any particular trigger – although I had some assumptions on the timing and recovery – focused on near normal waking hours but none of the graphs gave me any real clue.
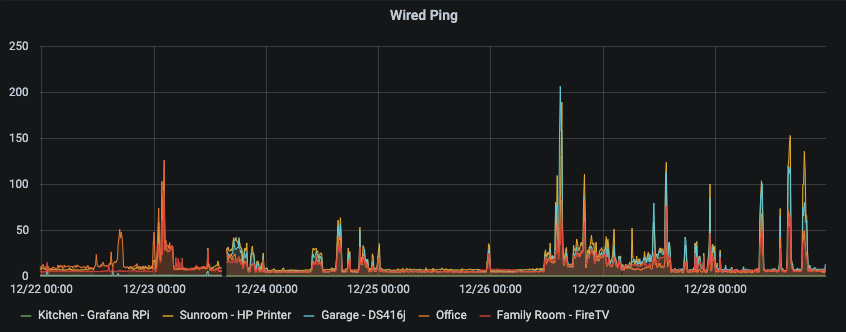
So now I had a hook about the fabric, let’s go one level up. Part of the reason I had Eeros scattered around the house was to allow me to have mini wired hubs in different places. So new ping filter for devices connected to the different Eeros. This graph gave me even more hope – the wired devices were likewise as consistent as the Eeros – when the network was performing well.
An interesting observation was that the network was *really* reliable during Christmas day – it was performing almost flawlessly. During Christmas you tend to stay off tech for a lot of the time as you spend it with Family. Of course I did some stuff just before Bed, and got up late on the 26th. Suddenly I had a hint it was something that we (possibly I) were doing on the network was causing the network instabilities.
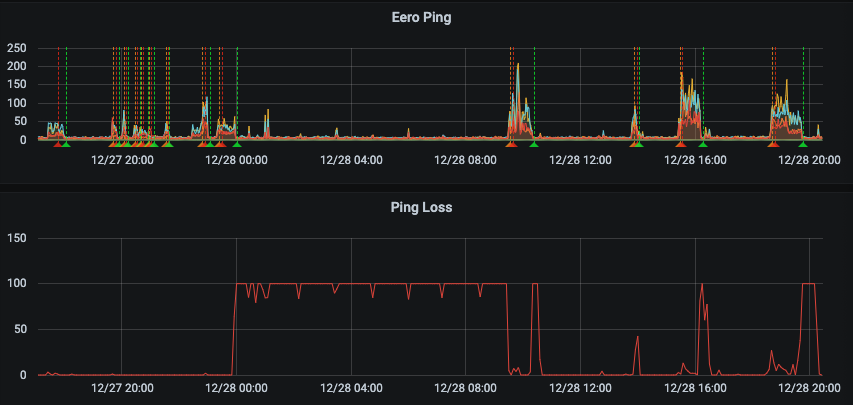
So with this information, I looked at the loss rate of the pings. I have full network visibility since I’m pinging the entire network mostly consistently. So with this information I can see when devices come on and off the network. The last 7 days looks like the other full network graphs, although in this graph I can see a substantial increase in lost packets during periods of network instability. Overall, the network has lots of devices on and off through-out the day. (I believe the loss > 100 is likely summing errors due to reducing the periods down to a single day). However this graph on its own doesn’t give much information.
So now I had enough information to start triggering alarms. I chose to create a private Discord server and send a notification to that. This at least gave me a 5-10 notification after the network had started performing poorly. After a few observations, I managed to catch this behavior. You can see around 9:30 the network started to perform poorly. At the same time the red line came down from the top. This indicates that a device came onto the network. It also was removed from the network just before the network recovered.
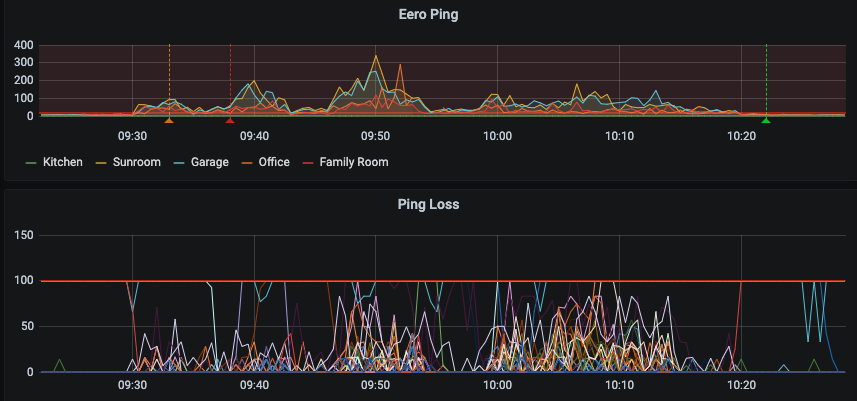
Isolating that particular host provided an even stronger correlation across a number of days. Although there are not enough close triggers for the presence of the host and the poor network behaviors. When the host was not connected to power, and would periodically wake up and do network activities (the dips in the lower graph away from 100), it would cause network instabilities matching perfectly with the periods of awakedness. In particular, when the host came on at 9:30, and went off at 10:20, the network issues disappeared.
That device is a Macbook Pro running MacOS Big Sur.
Now when I was armed with that correlation of the system, I started looking more deeply into the relationship. You can see that I’ve been able to recover fairly quickly when there is a network connection issue. Initially I would shutdown the entire Mac. Now I can switch off the network on the Macbook to get the network to recover.
Eeros have a primary and guest network. It appears that connecting to the guest network allows the network to operate correctly.
Sometimes the macbook will cause network performance issues immediately, other times it will strike randomly. But each time I can take the MacOS Big Sur offline and the network will recover – almost immediately.
So at least now I have the ability to get my network in a good state again. Unfortunately it means taking my primary machine offline to get it running. I think the above narrative provides a lot of useful information to allow Eero to begin to dive more deeply.
What I’ll be doing next is sitting the Macbook on a secondary – isolated network connected to the Kitchen eero. It’s less than ideal, but it should give me the ability to continue to debug and analyze while at the same time provide increased stability for the network.
Finally, there are always other interesting things that you’ll discover on your network when you begin to look closely. I can see there is a small performance degradation over time with the cable modem, and there a factory reset/reconfigure of the Roomba 960 improved the ping behavior there. Once I’ve got the fabric of the network improved, I’ll be going through each unusual behavior that I see and hunt down other network quirks.
